Ryan Yates – B00734878
June 11, 2020
When it comes to analysis data sets and asking ourselves questions about what
we can learn from the data and predict there are numerous factors to take into
account Examples of this can range from factors like the size of the data set being
used, the smaller a sample size being used compared to a total population will result
in a greater margin of error, there is also aspects like time frame if predictors on
certain behavior are being generated using datasets that has collected information
from every year or month from the past 50 years we could probably omit a certain
amount of columns and use the resulting subset of the data to build the prediction
model.
For this we are using data collected in regards to the ongoing Covid-19 Pandemic
and determining which subsets of the predictors given would be best to include in
improving models previously created suing methods such as k-fold cross validation.
In this lab by using forward step selection the program determines which predictor
variable from the subset would either best increase the likelihood of being correct or
result in the least decrease from the last iteration.
In this lab we are going compare the standard error rate from the models
generated through this method with the ones created in the previous k-fold cross
validation with models that were created through random selection. One question
that can ask be asked is how the error rates compare to each other as well as how
do using the best and forward method compare.
The Data
Model 1
for Disease Prevention and Control, which is an agency of the European Union (EU).
The dataset was then amended into a subsection consisting of the highest impacted
countries in North America from the Covid-19 outbreak spanning from March of 2020
to the present date as of this post. Countries included in this data are: Brazil,
Canada, Chile, Mexico, Peru and the United States of America. Figure one below is
a scatter point plot representing the number of new cases reported per day coloured
by country throughout the aforementioned time-frame.

Figure 1Scatter plot of New Cases reported per Day by Country
From the plot we can see just from the number of new cases per date there is
both areas where the countries have a distinct region separated from the other
countries being considered on the plot though there are also areas of overlap which
would suggest needing more than just a comparison of one variable to be able to
distinctly predict with confidence. This is where a multivariable model comes into
play,using the “best” and forward methods to determine which variable should be
selected as the model increases in complexity. To determine which of the methods
might generate better points a plot of the both methods R-Squared Values was
created and plotted below in figure 2.
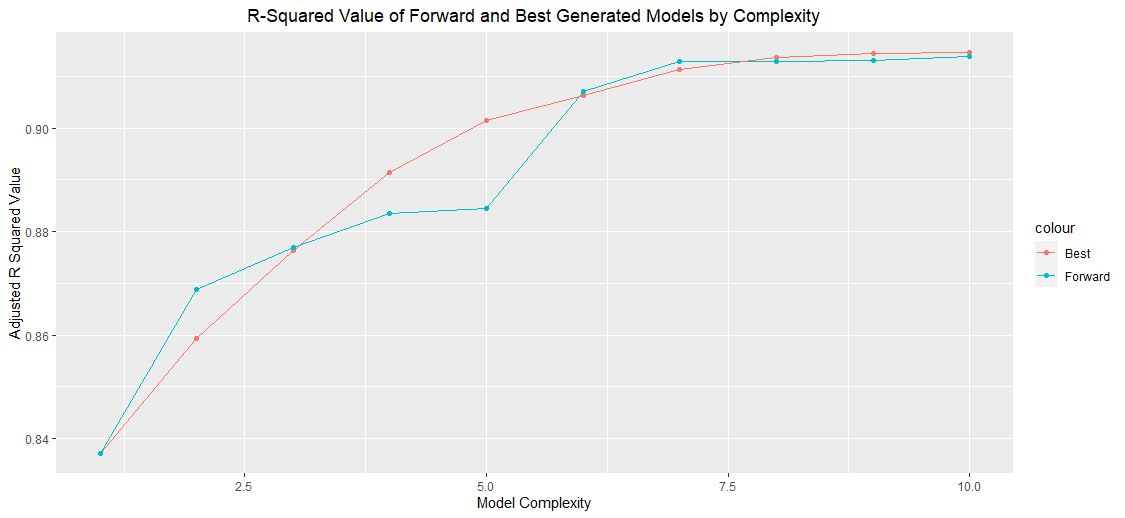
Figure 2:R Squared Value Comparison of Best vs Forward
From the plot above we can see that as the model complexity increases the
R-Squared value for the model trends upwards, eventually plateauing. For this
plot, at the starting point and end points the model’s R-squared value is the same
for both the best and forward method. In the intermediate nodes the best model
tends to generate a higher value R-squared number.
The Data
Model 2
For the second model the Dataset was further altered to match the same data used
in the previous K-fold post, therefore the data is the same countries from the first data
here with the time span reduced to the month of May 2020. Figure three below
depicts a scatter plot of each country’s new Covid-19 cases per day with a linear fit
and error range.

Figure 3: Covid19 Cases per Day in May 2020
From above graph it can be seen that each country has their own area with varying levels
of intersecting between each country. An example of this is that Brazil and the United states
have a well-defined converging area towards the last part of May while Canada, Chile, Mexico
and Peru’s have closer linear fits. The model this dataset is created from is attempting to
create an algorithm to correctly predict the country based on a varying level of predictors as
the model increases. Figure four below shows the standard error plot from last weeks model
set created based on pick and choosing variables to increase with each model compared to
generating a series of increasingly complex models through the best step method.

The figure on the left depicts standard error from the best step method while the right plot is the
standard errors from the previous series of models. From the one standard error rule both models
have the optimal models at iteration four. However, the average standard error for the best method
is approximately 0.14 a better value than the previous models which was .14.
What was Learned
Using different step model generation methods, we were able to compare the R-squared values
between the best and forward method for a model series of 10 models and determine that
throughout the series the best method usually generated a better value.
Secondly when comparing the standard error rate of a series of k models generated from the
best algorithm compared to a series generated from choosing on our own the average standard error
for the best method was slightly lower than that of the previous model. Suggesting a higher level of
precision when predicting.
No comments:
Post a Comment